
Feasibility of U.S. Transition to Electric Vehicles by 2035 Based on Energy Requirements
Introduction
As of the writing of this article (June 2023), a whole slew of U.S. car makers have pledged to go all-electric by 2035, with many aiming to go all-electric even before that. Putting aside the political, geopolitical, social, and economic implications of this decision, I’m more curious as to how feasible this is given the timeframe and the state of the U.S. power grid. So, this article will explore the current state of the automotive transportation industry and present a sort-of roadmap for the transition to electric vehicles (EVs) on American roadways.
This article makes use of public domain information where possible, such as the U.S. Department of Energy’s Alternative Fuels Data Center and Energy Information Administration. Links are provided to sources of input. If you find any errors in my analyses, please let me know.
While I am not against EVs and hope to own one once I feel the technology is sufficiently mature, I am against a brash and imprudent switch to a new technology without the infrastructure to support it.
Disclaimer and Conflict of Interest Statement
As a disclaimer, I am not an expert on power delivery, power plant construction forecasting, or EV manufacturing. I’m just a structural engineer who can read data sets and arrive at conclusions that seem logical based on the data given. Don’t use anything I say in this article without first doing your own research.
I also want to state that I do work in the power industry for a company that services power plants. My division specifically services nuclear plants, though other divisions in my company service and design fossil plants and renewable energy projects.
Additionally, I do own stock in various oil/gas companies and power distribution companies, and I own stock in one of the new nuclear small modular reactor companies. I also have exposure to different renewables projects and vehicle manufacturers through the target fund in my 401(k) retirement account.
That said, I will attempt to present the information in this article in an unbiased manner, and I do not make recommendations on investments.
Annual Miles Driven
The number of miles driven by Americans has been on a fairly linear increase since 1971, which is the earliest data I could find (graph below). In 2022, the total number of miles driven was 3.26 trillion. The year 2021 was low due to COVID.
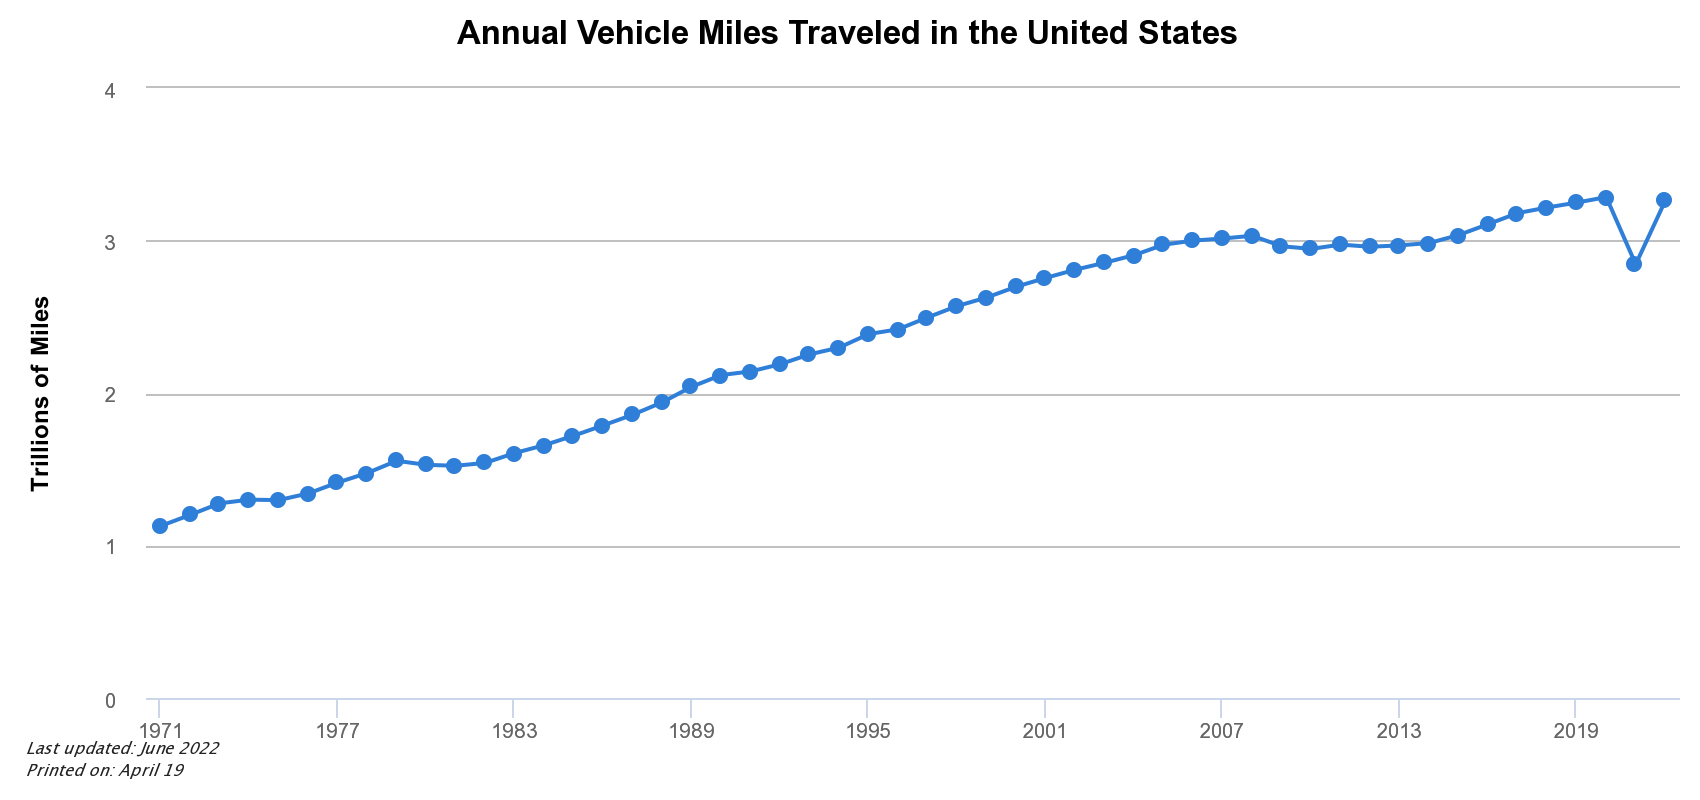
The graph does not indicate to which kind of vehicles these miles apply. According to 2021 U.S. Department of Transportation data, 3.48 trillion miles were driven by “light duty vehicle, short wheel base,” (passenger) vehicles. The 2021 DOT data included another 1.85 trillion miles for larger vehicles.
For the sake of this article, I assume that 3.2 trillion miles are driven per year by passenger vehicles with no increase over the next 12 years. These are the vehicles of interest for this article, as it appears that this is the main point of interest for car manufacturers in converting to EVs.
Annual Power Output
First, let’s get some terminology sorted. Power generation is normally given in kilowatts (kW) or megawatts (MW), which is a rate of energy generation. One MW is equal to 1,000 kW. Energy is given in kilowatt-hours. One kilowatt-hour (kWh) is the energy produced by a 1-kW power source over a 1-hour duration, and 1 MWh = 1,000 kWh. A 1-MW power source would produce 24 MWh per day, or 8,760 MWh (8.76 million kWh) per year assuming continuous operation. For comparison, a “typical” nuclear power reactor operates at around 1,000 MW.
Additionally, there is a difference between generation capacity and generation output. Capacity refers to the nameplate amount of power that a plant is capable of producing at peak. Output is the actual resulting power produced and sent to the grid when accounting for fluctuations in insolation, wind speed, downtime, and other factors. For example, a solar panel may have a rated capacity of 100 W but only have an effective output of 25 W since the sun doesn’t shine all day. This example solar panel would have a capacity factor of 25%, indicating that its actual output is only 25% of its nameplate capacity.
In 2022, the US generated 4.243 trillion kilowatt-hours (kWh) of energy according to the EIA. This is equivalent to an average of 484,360 MW of continuous power generation every hour of every day. This energy was generated by the following power sources:
Fossil fuels: 60.2%
Natural gas: 39.8%
Coal: 19.5%
Nuclear: 18.2%
Renewables: 21.5%
Wind: 10.2%
Hydropower: 6.2%
Solar (photovoltaic plus thermal): 3.4%
Other: < 1%

Of the ~21% share of renewables, the chart below breaks down the different constituents over time. Hyrdoelectric and biomass have been relatively consistent since the 1990s, but wind and solar have greatly increased in the past 20 years.

Of this power output, it was consumed by the following sectors in 2021 (source: EIA):
Residential: 38.9%
Commercial: 34.9%
Industrial: 26.0%
Transportation: 0.2% (mostly for public transit)

Analyses
Replacing a fossil-fuel-burning vehicle with an EV will take a vehicle that is more-or-less independent of the electrical grid and convert it to one that is wholly dependent on the grid in order to function. Thus, U.S. power generation capacity will have to ramp up in order to account for the new cars that will be charging from wall sockets instead of filling up at the pump.
Even if all car manufacturers were to switch to EV production by 2035, there would still be fossil-fuel-burning passenger vehicles for, say, a decade or more. Not only will there be people unwilling to switch to an EV, there will be people financially unable to do so by the 2035 timeframe given the relatively large cost of a new vehicle. Even for someone interested in a used EV, the cost to replace worn out batteries can be substantially more than a used gas or diesel car.
For the sake of this analysis, I assume that the entire fleet of passenger cars in the U.S. will gradually switch to EVs by 2045, 10 years after the supposed adoption of all-EV manufacturing in 2035. While the actual date that the substantial majority of cars (say 95% plus) will be EVs is unknown, this allows a 10-year window for those with existing fossil-fuel vehicles to switch over after 2035. Thus, the timeframe for full EV adoption from the current date (June 2023) is taken as 22 years. For the sake of argument, I assume a steady replacement of gas/diesel cars with EVs over these 22 years to allow a smoother transition.
Power Usage from EVs
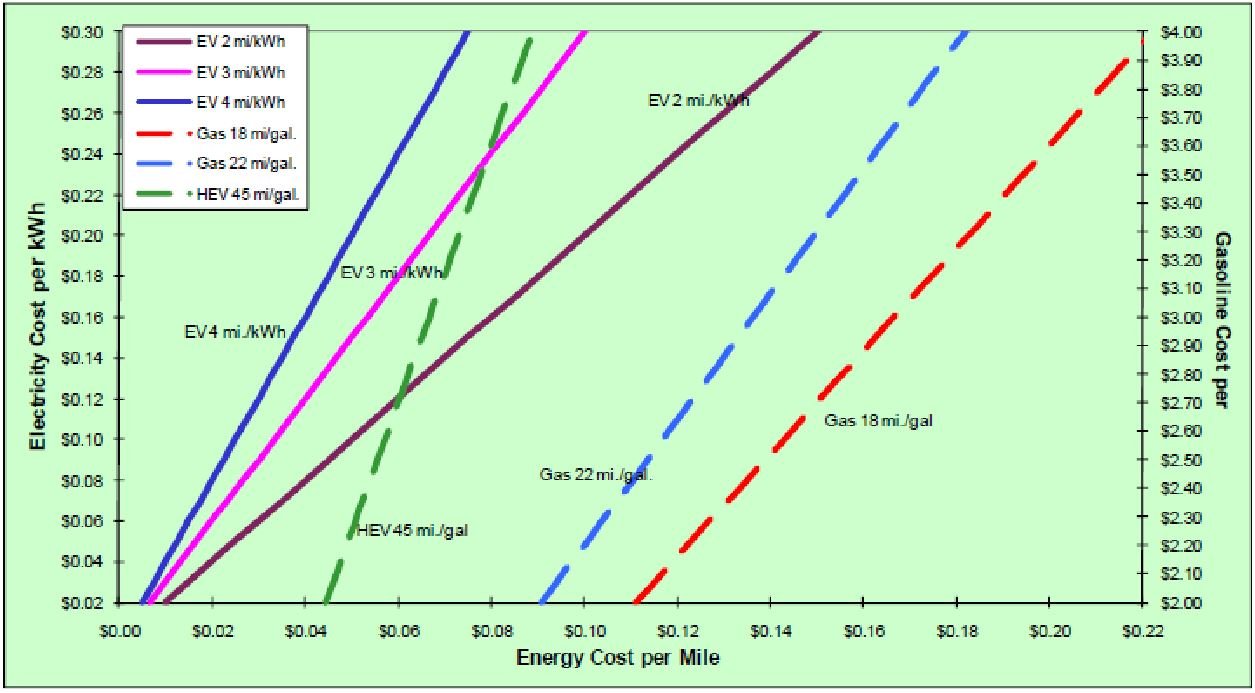
I was unable to find a good average for how many miles an EV can be expected to get per kWh of charge. A report by Idaho National Laboratory included curves for 2, 3, and 4 miles per kWh of charge (see graph below). Looking on Google, I find values anywhere from 2.5 to 4 miles per kWh. I will assume an average of 3 mi/kWh for this article.
The previous section indicated that EVs constituted essentially zero demand on the power grid in 2021. I assume this has increased in the intervening two years, but let’s say that EVs account for about 1-2% of total energy consumption as of April 2023. This is still zero from a practical standpoint and for estimating purposes.
Considering an EV mileage of 3 mi/kWh and the 3.2 trillion annual miles driven by American passenger cars, replacing every fossil fuel car with an EV overnight would require an additional annual energy output of 1.07 trillion kWh to account for current miles driven. That’s about 25% of the ~4.2 trillion kWh annual energy output of the nation.
Even with more energy-efficient appliances, lighting, etc. being adopted, it is unlikely that U.S. energy consumption is going to fall in the next 22 years. Therefore, in order to power all of the miles driven by EVs, new power plants need to come online to make up the increased 1.07 trillion kWh demand. For simplicity, I’m assuming that non-transportation energy usage will stay the same.
New Power Generation
In order to meet the supposed goals of converting to EVs, I assume that policymakers will want any new power generation to be either via renewables or other carbon-free energy (i.e., nuclear). As stated before, nuclear and renewables represent about 18% and 21% of current power generation, respectively. I assume that hydropower will not be a share of this new power generation as it has a substantial non-pollution environmental impact and will be viewed as unfavorable.
As noted above, 1 MW-equivalent of continuous power output equals 8.76 million kWh per year. For comparison, the average house consumes about 886 kWh per month (10,632 kWh per year or 29.5 kWh per day). Averaged across 365 days a year, the 1.07 trillion kWh yearly energy demand for new EVs would require 122,150 MW of continuous power generation capacity. That’s 5,550 MW of new, carbon-free power generation per year for 22 years.
Nuclear Power
According to the EIA, there are currently 93 operating nuclear reactors in the U.S. Using the EIA’s power production data, they generate about 772 billion kWh total per year, for an average of 8.3 billion kWh per reactor per year (average of 945 MW per reactor). To produce the necessary 1.07 trillion kWh of energy used by new EVs would require the construction of about 130 such reactors, or about six reactors per year until 2045.
Two new reactors are currently being built at the Vogtle site. Unit 3 synced to the electrical grid earlier this year, and Unit 4 is expected to do so later this year or in early 2024. Prior to that, the next most recent was Watts Bar Unit 2 in 2016, and then Watts Bar Unit 1 in 1996 (source: EIA). Nuclear plants take a long time to get built, largely due to the regulatory burden imposed by the Nuclear Regulatory Council (NRC), and also due to a lack of construction expertise in the industry stemming from the long hiatus on building them.
The NRC maintains a listing of new nuclear plant applications on its website. However, just because an application is approved does not mean that a reactor will get built. Economic, political, and social factors all play a role. Aside from the two units at Vogtle, no new plants are under way. TerraPower is planning a Natrium reactor in Wyoming, with an estimated completion in 2028. Assuming any new plants have a similar four-year construction timeframe, that would mean that we would need to see seven or eight 1,000-MW reactors begin construction per year starting in 2024 in order to build 130 new nuclear reactors by 2045.
(Note that the TerraPower Natrium reactor is an advanced design with only 345 MW-equivalent capacity, or roughly 1/3 the ~1,000 MW capacity of the current fleet of reactors. Above I assume that any new plants would have similar 1,000-MW capacity to current reactors. If not, then even more reactors would need to be built in order to generate the requisite energy.)
Wind Power
The USGS estimates that an average wind turbine can produce about 843,000 kWh per month (10.1 million kWh per year). This is based on a 2.75 MW mean capacity with a 42% capacity factor (1.16 MW equivalent output). The 1.07 trillion kWh/year required by EVs would necessitate the installation of 106,000 wind turbines, which is 1.45 times as many as the ~73,000 turbines currently operating in the U.S. That’s 4,800 turbines per year, or 13 per day for the next 22 years.
Solar Power
I was unable to find any averages for power output per solar panel. Likely any number I’d be able to find would be moot in a year anyway since solar technology keeps improving.
The Solar Energy Industries Association states that over 10,000 1-MW solar installations are in operation or development in the US (current as of June 2023). Most solar installations are between 1-5 MW, though the bulk of generation comes from 50-MW plus installations.
Considering a 5-MW installation, 24,430 such installations would need to be installed by 2045, or 1,110 per year, or about three 5-MW solar installations per day for the next 22 years.
Land Use
Nuclear Power
The current land requirements for nuclear power are about 1 square mile (640 acres) per 1,000 MW of generation. Nuclear power has a very high capacity factor (93% per the DOE) since such plants operate 24 hours a day, rain or shine, windy or not. Considering the capacity factor, this equates to about 0.69 acres/MW equivalent.
The 122,150 MW of new power generation for EVs would then require about 84,300 acres (132 square miles) of land area, or six square miles of development per year over 22 years. The 132 square-mile total is about the size of Philadelphia, PA.
Some of the new nuclear plant designs are even more energy dense. The NuScale small modular reactor design, for example, proposes to house a 924 MW-equivalent VOYGR plant on just 34 acres (about 0.04 acres/MW when accounting for a 93% capacity factor). This is about 6% of the land area used by the traditional nuclear plants in the fleet today, or a total of only 4,730 acres (7.4 square miles) to make up the 122,150 MW of new generation output required.
Wind Power
Wind turbines require a significant amount of acreage per MW production since they need to be spaced relatively far apart and need to be sited to account for a blade throw accidents. Estimates vary, but I’ve been able to find an average of 85 acres/MW capacity, or 202 acres/MW output when accounting for the 42% capacity factor.
To generate 122,150 MW of power, an area of 24.7 million acres (38,500 square miles) would be required, which would be 1.12 million acres per year or 3075 acres per day over 22 years. This is about 95% of the land area of Kentucky. However, bear in mind that wind farms can be sited on existing farms or on otherwise usable land given the large spacing requirements, so it’s not like this entire acreage would be unusable. Wind turbines can also be located offshore.
Solar Power
Utility-scale solar power may require between 5 and 10 acres per MW of capacity. Solar power’s capacity factor is about 25%, with sunnier states having higher capacity factors. So, assuming the more-efficient 5 acres/MW, it would require about 20 acres for an effective 1 MW of solar power output. Thus, an additional 2.44 million acres of solar installations would need to be built to (about equal to the land area of Delaware) to generate 122,150 MW of power, or about 111,000 acres per year, or 304 acres per day over the next 22 years. For comparison, Yellowstone National Park is about 2.2 million acres.
These 304 acres per day are just under half a square mile. Los Angeles International Airport covers about 3,500 acres. So, a land area equal to LAX would need to be covered in solar panels about every 11.5 days for the next 22 years.
If instead we assume that a solar installation takes up a less-efficient 10 acres/MW, then the acreage above is doubled to 4.9 million acres (i.e., one LAX-worth of acreage about every six days for the next 22 years; about 90% of the size of Connecticut in total). This is about the same acreage as Denali National Park.
Solar panels need to be at a fairly close spacing to achieve the power densities listed above, so unlike wind power, acreage taken up by solar panels is only really usable for solar power generation.
Other Topics
As one might expect, there are many more considerations in the transition to EVs than just power generation capacity. Discussion of each would make this article unduly long, and each would be worth a discussion on its own. In order to keep the scope of this article manageable, I will briefly discuss some of these other topics below.
Energy Storage
In an ideal world, you’d plug your EV in to the wall, and your local power plant would instantaneously ramp up power production to supply the electricity. This isn’t what happens, of course. The topic of power balancing between supply and demand is a bit beyond me.
A brief summary is that some sources of power (like coal and nuclear) are best run at a constant load and fill in the “base load” of the grid. Intermittent sources like wind and solar vary in their power output and aren’t controllable (for the most part). Dispatchable sources can be programmed on demand to fill in the gap left between these two sources and the current demand on the grid.
In order to prevent brownouts or blackouts, the grid will need to have more energy production capacity than peak demand. As such, to make the most efficient use of the production capacity, some form of energy storage is necessary. The energy storage systems are basically other forms of dispatchable energy.

It’s beyond the scope of this article to describe the current state of affairs of energy storage and how they would all tie in with the transition to EVs. However, energy storage would need to be a big part of any power generation strategy involving renewable energy to deal with the inherent intermittency of these power sources.
Power Distribution
Generating another 122,150 MW of power is one thing - distributing that power to the end user is another matter. Over 70% of the U.S. energy grid at least 25 years old, and the current distribution capacity is nowhere near adequate to support a 25% expansion in energy supply.
Additionally, the vast majority of the power grid is unhardened, meaning that it is susceptible to natural disasters or malicious attack. Lead time for power transformers, which used to be about three months, has ballooned out to years. It would not take much to knock out a significant amount of the U.S power grid and keep it down for a long time, nevermind upgrading the grid for the new demand placed on it due to EVs.
Charging Infrastructure
As gas stations serve to refuel the current fleet of fossil-fuel automobiles, so too will charging stations for EVs. For most cases, drivers would be able to keep their car’s battery topped off by charging overnight in the garage. However, for longer trips (or for drivers who regularly exceed the car battery’s mileage in a day’s travel), public-accessible charging stations are a necessity.
Anecdotally, I have seen more charging stations open up in the area I live (suburb of a major metropolitan area). That said, when I go anywhere 50 miles or more away from the city, charging stations are nowhere to be found.
Additionally, residents who don’t have a garage (such as apartment dwellers) would either need to rent a parking spot with a charger or rely on a public charging station. Numbers I could find online indicate that somewhere between 12% and 35% of people live in apartments in the U.S.
The American Petroleum Institute reports that there are about 145,000 fueling stations across the U.S. If we assume that only renters will need to use charging stations (I would consider this a gross underestimate), and also assume that 12% of residents are renters, then a low-bound estimate of 17,400 charging stations would be needed to service these drivers. That’s 791 new charging stations per year, or just over two per day that need to be built over the next 22 years.
Likely the throughput of an EV charging station would be less than that for a gas station. In other words, a typical passenger vehicle can fuel up an entire gas tank in under 10 minutes at a gas station, whereas charging an EV from empty to full would take more like an hour. Considering this ratio, a charging station would need about six times as many charging slots as a gas station would pumps in order to have the same throughput.
Materials for EV Production
Production of new EVs will require material resources. Except for the batteries, motors, and computer systems, likely the materials needed will be much the same as those needed for current fossil-fuel vehicles. Additionally, some materials, such that those needed to withstand the high temperatures and pressures in an internal combustion engine, or in a catalytic converter, may not be needed at all for EVs.
For EV batteries though, the supply chain issues for cobalt, which generally comes from conflict regions and uses effectively slave labor to mine, are an obvious issue. This isn’t an issue specific to EV batteries, as cobalt is used in a variety of industries, and even in your cell phone. The U.S. Congressional Research Service published a paper in 2022 on the topic of critical metals for EV batteries for further reading.
Conclusions
As I stated at the top of the article, I am not opposed to EVs, and frankly the idea of not having to deal with oil changes and other maintenance headaches that accompany internal combustion engines is very appealing to me. I’ve switched over a lot of my household garden tools from gas to battery for this precise reason.
That said, just based on the numbers, we as Americans really need to get things into gear if we want to switch over to EVs by 2045. Not only that, but the land use issues that accompany new power plant installations will need to be worked out at the federal, state, and local level given the relatively large space required for some of these power sources. Given the plodding speed of government, I have to say that I’m pessimistic.
However, perhaps it’s not all doom and gloom. The American Public Power Association published a whitepaper in 2022 with a update on the current and future state of U.S. electricity generation capacity. It states that a whopping 412,000 MW of new generation capacity is under development in the U.S. (about 113,000 MW under construction and 299,000 MW proposed or pending application). Tables 3.5 and 3.6 of the report tabulate the split of this new capacity between wind, solar, nuclear, fossil, etc. The majority of the sources for the 412,000 MW are solar or wind.
Remember that capacity and output are not the same, so the proposed 412,000 MW is not the effective output when accounting for the capacity factor. Assuming a 25% capacity factor for solar, the 412,000 MW would be an effective output of 103,000 MW, roughly 85% of the required output needed to power new EVs.
Time will tell if enough power plants will come online to power all the new EVs that are supposed to be on the road by 2045. Personally, I plan on sticking with my reliable gasoline car until I’m sure the infrastructure can support a change to an EV, and until I can do a road trip without needing to stop for an hour plus to refuel.